Your capital is at risk when you invest. Never risk more than you can afford to lose. Financial products are complex instruments and come with a high risk of losing money. Click here to view our full Risk Warning
Capital Markets Elite Group (UK) Limited is now Mondeum Capital (UK) Limited. This is a name change only, our ownership, regulatory permissions and services remain unchanged.
Your capital is at risk when you invest. Never risk more than you can afford to lose. Financial products are complex instruments and come with a high risk of losing money. Click here to view our full Risk Warning
Trade and invest in US stocks and ETFs faster, with fewer limits
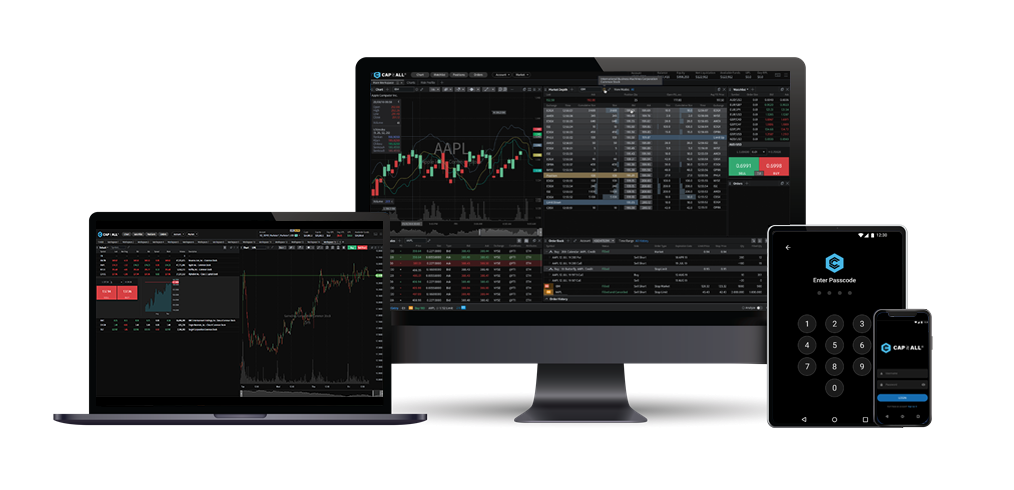
Get instant access to major markets and multi-asset trades and investments.
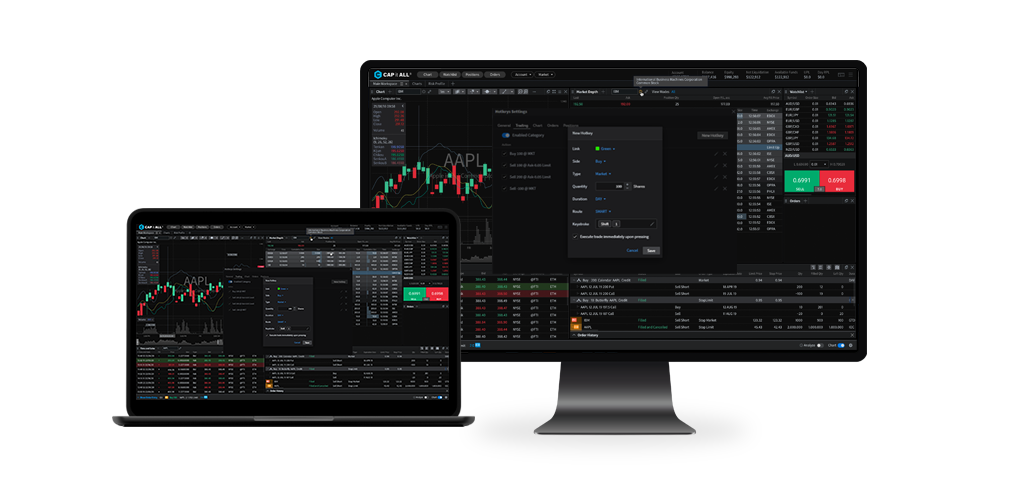
Introducing the power of stock trading at your fingertips with our advanced hot key functionalities. We have made it even easier for you to execute your trades in ultra real-time.
Hot key trading
Made for Active traders to react quickly to market changes, enter and exit positions swiftly with one key stroke, as well as managing multiple tasks simultaneously.
Advanced charting and analysis tools
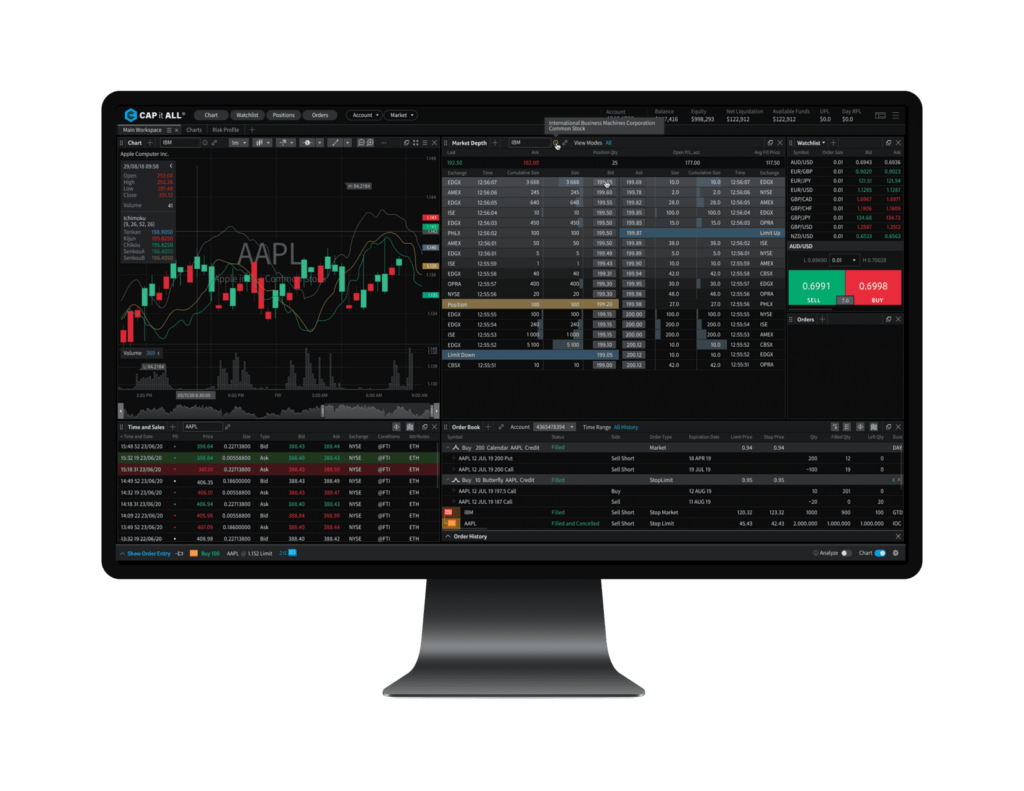
Access real-time L2 data, dynamic charting, and robust analysis tools across multiple screens. Traders have access to multiple smart order routing strategies that are customised to the way you trade.
Simple and powerful
CPro gives novice and sophisticated traders alike the ability to navigate the trading markets easily and with professional grade trading technology.
Our proprietary trading platform CAP it ALL is designed by traders for traders. Clean, customisable and just what any trader ordered. And the best bit? It comes with a free option.
Trade your way
CAP it ALL comes with a minimalist, no frills interface that allows you to customise your screen the way you want to. Spread it out. Make it yours. Simple, but powerful.
Accessible
Trade on the web, your desktop or mobile. CAP it ALL goes where you go and is designed by traders for traders.
Free platform
No platform fee to use CAP it ALL. Market data fee will apply based on the venues requested.
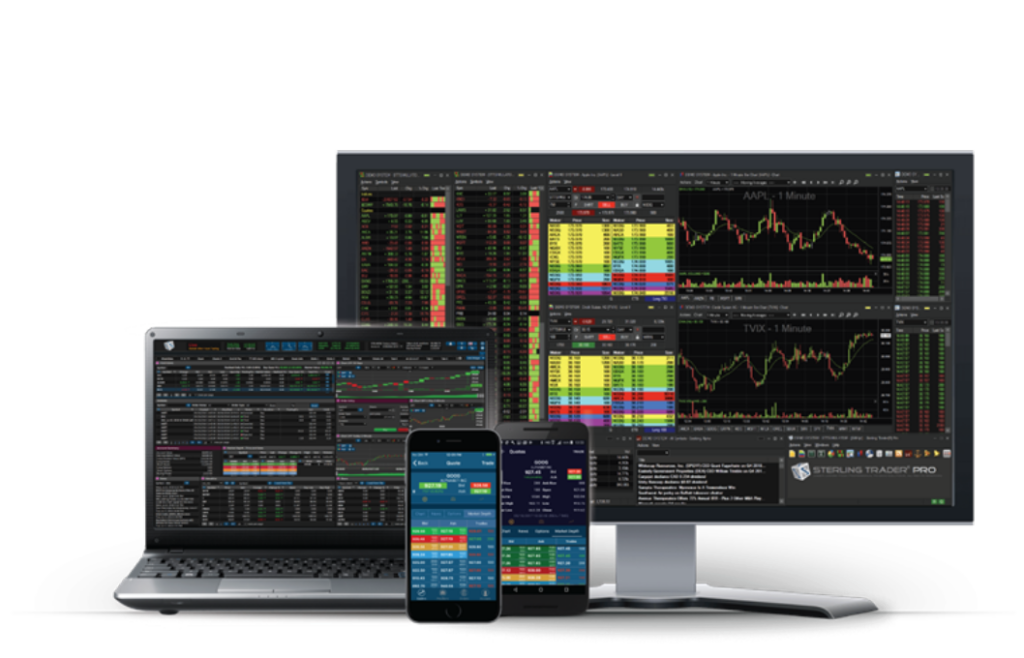
This platform is designed for active traders and professionals who work with the rapidly moving electronic markets. The powerful performance and configurability give traders complete control over their trading.
Hot Key Trading
Utilize over 100 hotkey options for faster order entries.
Advanced Charting, Watchlists and Scanners
All the right tools to help you take advantage of opportunities in the market.
Capital Markets Elite Group (UK) Limited is now Mondeum Capital (UK) Limited.
This is a name change only, our ownership, regulatory permissions and services remain unchanged.
Capital Markets Elite Group (UK) Limited is now Mondeum Capital (UK) Limited.
This is a name change only, our ownership, regulatory permissions and services remain unchanged.
Age Restriction
Please confirm that you are over 18 years old to continue